You probably have a conceptual understanding of what Transfer Pricing (commonly acronymized as TP) means and how it’s supposed to work. On an abstract level, you may even know the differences between and the workings of the various acknowledged Transfer Pricing methods and their applicability. If not, please read our other Transfer Pricing articles on the subject matter, which even provide some actual footing for understanding the concepts on a more pragmatic level:
The 5 OECD Transfer Pricing Methods Explained – Archipel Tax Advice
And:
Transfer Pricing 101: Dealing with Intercompany Transactions – Archipel Tax Advice
But if you’re completionist of nature and a theory enthusiast, we recommend you take a look at the Holy Book of Transfer Pricing (as it is often perceived by tax advisors from OECD countries): the ‘OECD Transfer Pricing Guidelines for Multinational Enterprises and Tax Administrations‘, January 2022 edition.
In This Post, We Deep-Dive in the Application of Several Transfer Pricing Methods
There appears to be an abundancy of online articles where the concepts of Transfer Pricing are described, but very few provide example calculations and potential hands-on approaches to Transfer Pricing challenges. We decided, therefore, to skew the average content of Transfer Pricing articles out there from the conceptual side to the ‘how to actually do it?’ side, if only a little bit.
Operational versus Financial Transfer Pricing
In this article, we will look at just the Operational Transfer Pricing aspects. This means that, whichever Transfer Pricing Method we evaluate, the Financial Expenditure (e.g. interest payable on loans) and other non-operating expenses/income are out-of-scope for the Transfer Pricing exercises. Financial Transfer Pricing mainly entails application of the Comparable Uncontrolled Price Method (CUP) to determine an arm’s length interest percentage.
Other Financial Transfer Pricing aspects can relate to, for example, situations like the following, in which ultimately the arm’s length interest rate still is the central item. In year X, Company A has entered into a loan agreement with a related party, Company B, at a 5% ESTR-based annual interest rate with a 10-year maturity. The loan agreement contains a provision based on which Company A can prematurely repay the entire loan if it wants to.
In year X+3, the ESTR rate takes a dive, and Company A avails of sufficient liquidity to repay in full. However, it does not. Tax Authorities may then conclude that an independent borrower would have made use of the repayment option in order to refinance at lower interest rates (or not refinance at all). The contractual interest rate will therefore not be allowed for a full deduction in Company A’s tax position.
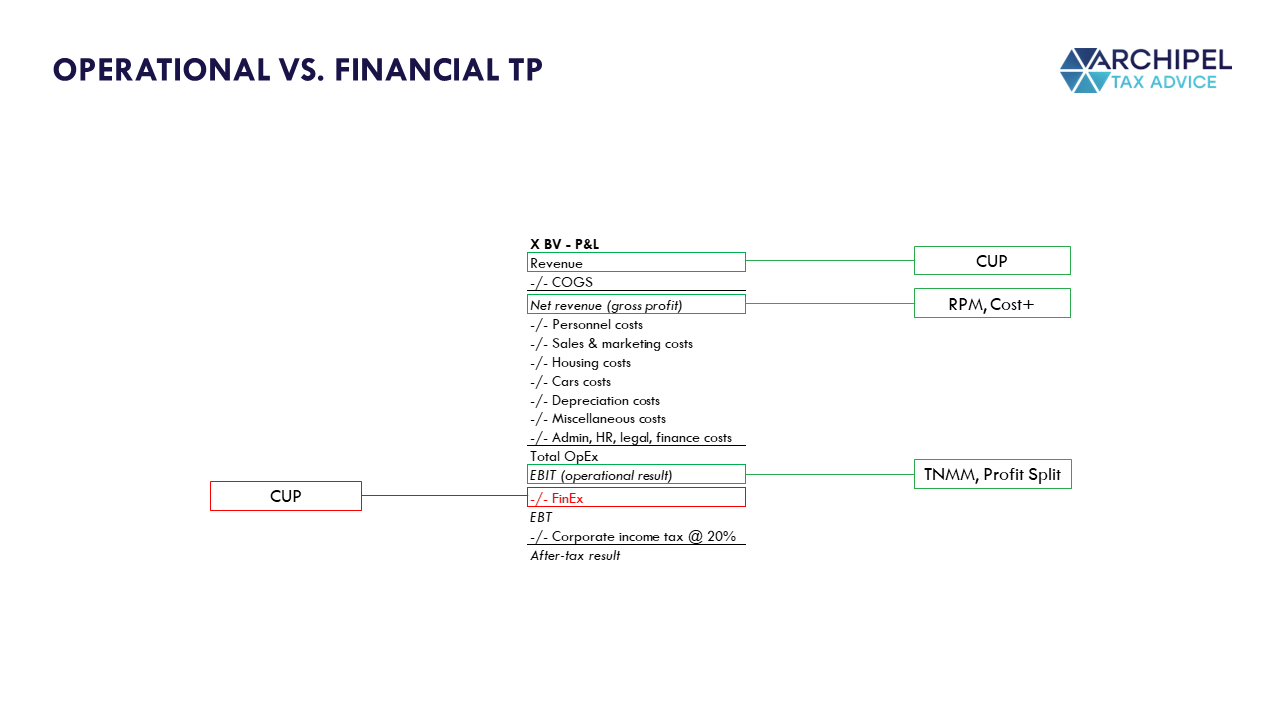
An arm’s length Operational Net or Gross Margin should be able to, at least in the budgeted figures, cover the FinEx, even though the tax-reportable height of the FinEx (to the extent payable to / receivable from related parties) is determined through a separate methodology.
Of the two main TP categorizations, we only treat Operational Transfer Pricing from here on down.
Transfer Pricing: Theory versus Practice
Keep in mind that practice often (slightly) deviates from theory in the realm of Transfer Pricing. For example: B Ltd., a company’s entire business is providing auxiliary services to C Ltd., another group company, e.g. invoicing services. If, after an assessment of B Ltd.’s Functions, Assets and Risks (FAR), B Ltd. is determined to be (fiscally) entitled to a remuneration from C Ltd. based on B Ltd.’s cost level, due to absence of (significant) functions, assets and risks. There are generally 2 cost-based methods:
- The ‘traditional’ Cost Plus Method, which yields a percentual Gross Margin that determines the net revenue (or gross profit) in relation to its direct and indirect costs; and
- The (way more often applied) Transactional Net Margin Method with ‘Net Margin to Total (Operational) Costs’ as Profit Level Indicator, or simply: the TNMM on a cost basis.
The latter is commonly referred to as the Net Cost Plus (NCP), so for clarity’s sake, I’ll refer to the former as the Gross Cost Plus in this article.
The Gross Cost Plus takes into account the (operational) Gross Profit as a ratio of revenue-related costs (depreciation and COGS) to the extent that those costs contribute to the value creation of the Cost Plus entity (or an entity’s Cost-Plus-activity, if it does more for group companies than just the one intra-group activity). The exploitational costs (i.e. costs that are not directly revenue-related) and FinEx should be covered from the Gross Margin.
The Net Cost Plus takes into account all operational costs to the extent that those costs contribute to the value creation of the NCP-entity (or an entity’s NCP-activity, if it does more for group companies than just the one intra-group activity).
Theory versus Practice: Cost Allocation and Mark-Up on Costs
For example, if a Cost-Plus or NCP-entity acquires raw materials for €10,000 for processing, but it cannot/does not exercise any form of control over the risks associated with those raw materials, the costs are not included in the to-be-marked-up cost base. They can, however, be surcharged to other group companies without a mark-up, which companies would generally be allowed to deduct those costs from their respective tax bases. Those costs could even be said to be a priori allocable to other companies than the Cost-Plus or NCP-entity itself, due to the lack of control at the Cost-Plus or NCP-entity.
So, from a clean Corporate Income Tax perspective, those costs should not even appear on the tax P&L. It’s therefore rather seen as a surcharge (disbursement) on another company’s behalf (and for that other company’s account), which can lead to a (fiscally visible) debtor/creditor relationship if payment of that disbursement invoice is carried over the financial year-end.
Even if certain costs are a priori allocable to a Cost-Plus or NCP-entity, they can still be excluded from the to-be-marked-up cost base. For example, if such entity acquires certain services from a third party service provider and subsequently ‘resells’ those exact services to a group company. The risks of that ‘service reselling’ (similar to dropshipping, but with services instead of goods) may be controllable/controlled by the Cost-Plus or NCP-entity, but the costs that that entity incurs for its innate service-dropshipping activity are way lower than the fees it pays to the third parties.
Because the Cost-Plus or NCP-entity functions as a passthrough station for those services and cannot be said to add to the value of the Cost-plus or NCP-entity itself, the third party service fees are excluded from the to-be-marked-up cost base.
However, in practice, generally all operational costs are included in the to-be-marked-up cost base.
Theory versus Practice: Budgeted and Actual Costs
Furthermore, there’s a big difference between budgeted and actual costs in Operational Transfer Pricing, at least on the theoretical side of the spectrum. In theory, an NCP-entity should relay its forecast cost budget for the next year to the group company that enjoys that entity’s routine services. If the actual costs turn out to be higher than the budgeted costs, a third party client (contractee?) would not just accept post-agreement mid-term fee increases due to operational inefficiency on the service provider’s side. Operational (inefficiency) risk is generally borne by the service provider itself. That way, the service provider has no foul incentive to let its costs (to which the mark-up applies) explode.
So, if we were to follow that logic, the service provider could – justifiably so – report a taxable Net Margin that is lower than the Net Cost Plus Margin that was benchmarked/agreed on beforehand, or even a tax loss if that benchmarked margin cannot make up for the operational inefficiency.
However, in practice, the actual costs are taken as the determinant for the NCP’s cost base. If the actual costs turn out to be higher (or lower!) than the budgeted costs, additional (credit) invoices are sent per financial year-end to align the taxable Net Margin with the arm’s length Margin that was benchmarked.
This practice appears to be in contravention of the arm’s length principle itself, due to the fact that operational inefficiency is rewarded with a higher Net Margin. But, on the other hand, working with the actual costs takes away another foul incentive for group companies to ‘mess with’ the cost budgets beforehand. So it appears that the Transfer Pricing practice has chosen the lesser evil, because actual costs are less susceptible to manipulation than budgeted costs.
Case Study: a Spaghetti Sales and Dough Consultancy Business
In our case study, we have two companies, both held by the same shareholder. The companies are X BV and HQ LLC, both of which are resident of jurisdictions adhering to the OECD TP Guidelines. We focus on the arm’s length remuneration for X BV’s intra-group services.
The group is dough-orientated: the group acquires dough from the market, processes it to make spaghetti from it and sells the spaghetti to customers in the Netherlands and the U.S. HQ LLC is the Key Entrepreneurial Risk Taking (KERT) entity in this regard, whereas X BV helps HQ LLC to prospect and close sales in the Netherlands. So even though X BV labels this activity as Sales Support, the Sales Support fte do not merely partake in routine tasks, but also contribute on a strategic level.
X BV additionally performs R&D Services to HQ LLC. The R&D relates to dough mixture and texture perfection. Furthermore, X BV provides Consultancy Services to third parties, an activity branch within X BV that is fully self-operating and stand-alone. The Consultants ‘manage & admin’ themselves. Finally, Some of X BV’s non-Consultancy fte are occupied with management tasks.
X BV has invoiced its Consultancy clients for €900,000 and has invoiced HQ LLC for €1,200,000, a rough guesstimate of the year’s value of its intra-group services provided to HQ LLC. This was done on on actual costs basis.
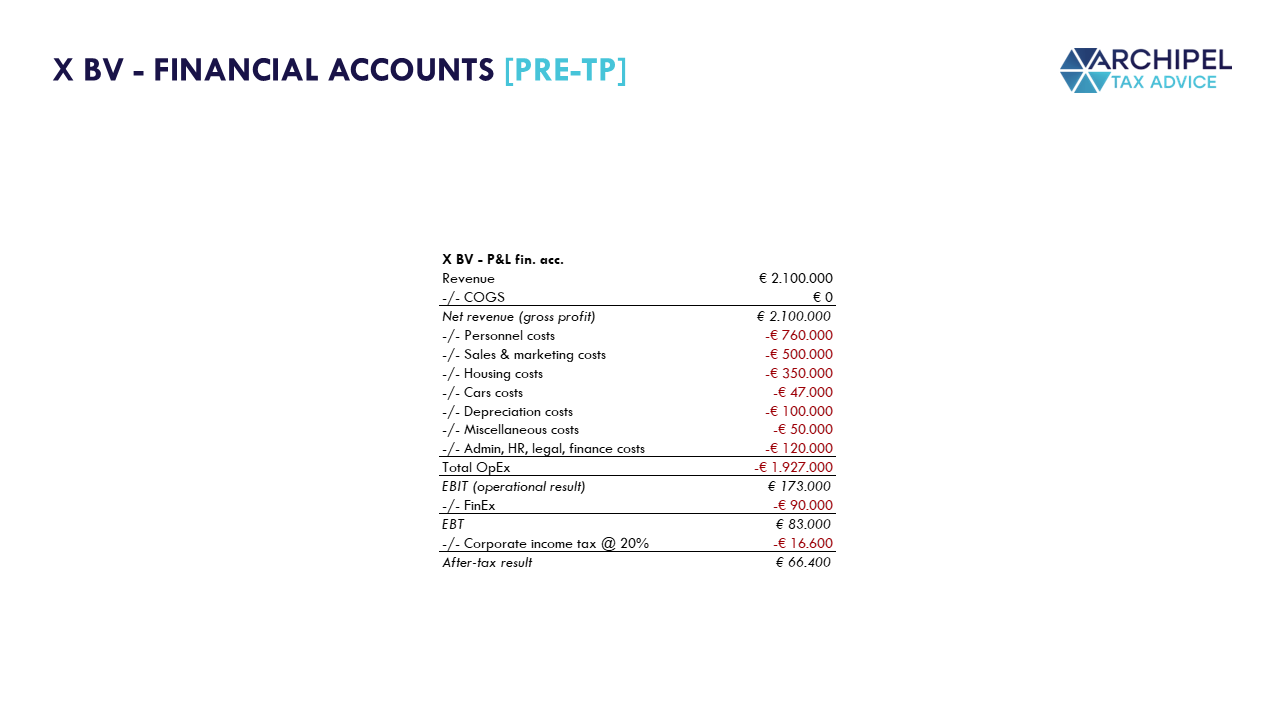
X BV’s Financial Accounts for Year X are as follows:
Splitting the P&L into a Third Party Component and a Related Party Component
The big question is whether or not the figures from the Financial Accounts can be used as a basis for X BV’s Corporate Income Tax Return. X BV think they can and decides not to hire a tax advisor. X BV will go about it in a quite sophisticated manner: after having read several Transfer Pricing related articles online, X BV will split the Financial Accounts into separate sub-P&Ls per activity based on the time allocation and salary & car costs of its employees. The following, factually accurate, split per person and activity type is used:
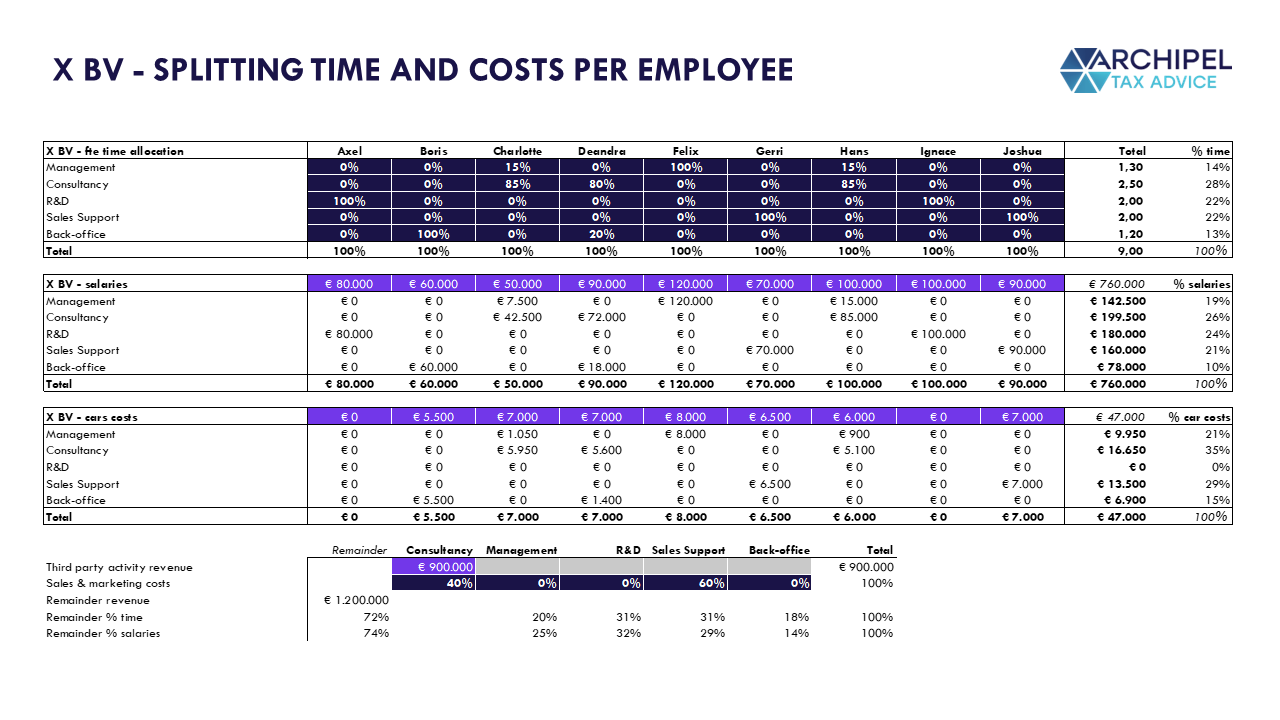
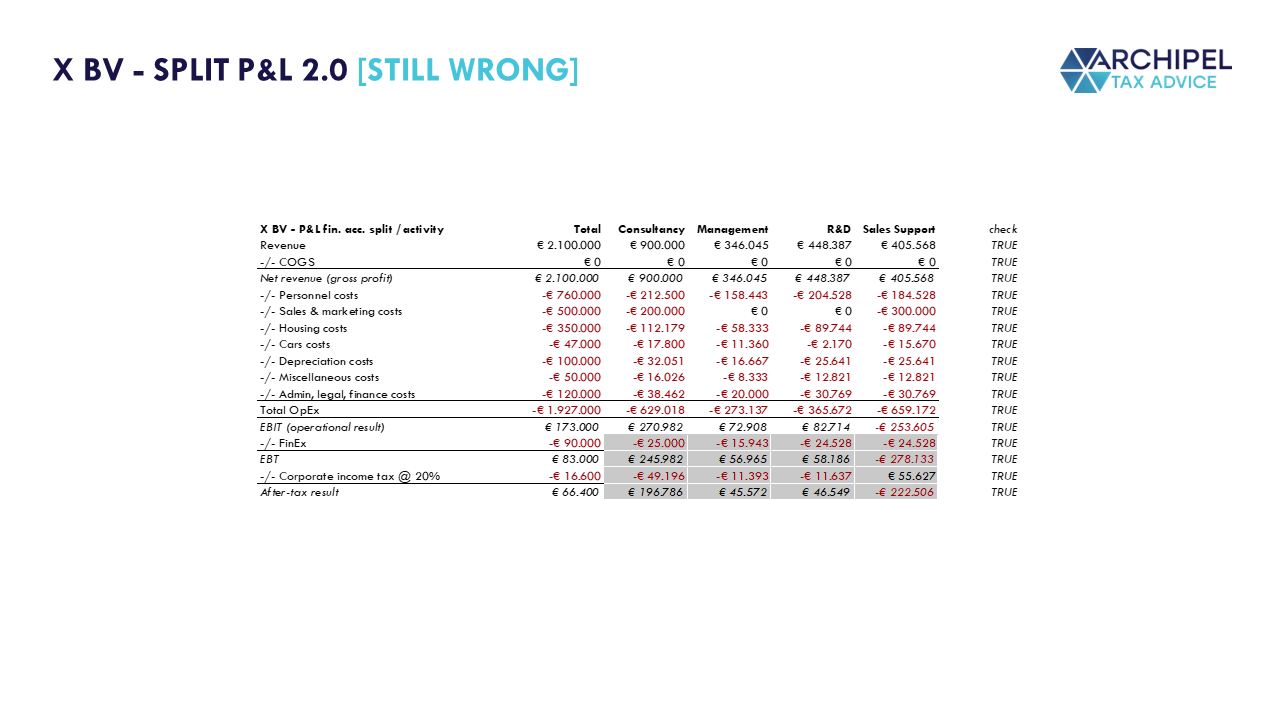
This matrix leads X BV to believe that the P&L activity split is as follows [SPOILER: despite X BV’s genuine efforts, it’s not entirely the ‘TP-Certified’ way to do it!].

The greyed-out cells contain irrelevant data: X BV is taxed as a whole. The separate activities are not taxed separately. Regardless, the reason for this split P&L being incorrect is that this sub-divided P&L still (unjustifiably so) presumes the correctness of the total revenue of all activity types combined. It may very well be that the €2.100.000 is too high or too low considering the services provided, especially seeing as most activities within X BV are related party, intra-group activities. In principle, the same goes for the amount of costs,
Splitting the P&L as shown above, is helpful, however, in two instances:
- It does show quite accurately what the ‘third party’ part of the P&L looks like, which is ‘out of scope’ for Transfer Pricing purposes; and
- On the intra-group side, the split is quite accurate especially in relation to the OpEx, because those costs are almost entirely inherent to X BV itself. The basis for the OpEx split is the actual time allocation by the employees and their salaries and which cars they drive.
Obviously, in case of disbursements (company A pays for something (partially) on behalf of company B, a related party), a simple surcharge would suffice, without a mark-up. In our case, such things have already been taken care of in the financial accounts. In other words: all OpEx in X BV’s financial accounts are its own costs.
For personnel-related costs, a ‘naked’ surcharge often isn’t appropriate, because there are many other costs associated with having people on the payroll that would render a simple group-surcharge for a single fte ‘loss-making’ for the employer. Think of the office rent, admin, HR and other costs. In essence, when you take into account such costs (proportional to that fte’s time allocation for the to-be-surcharged group company) you are in fact applying the Net Cost Plus method (TNMM with EBIT over total operational costs as Profit Level Indicator) to that fte. We will expand on that further on in this article.
Merging Auxiliary Activities with Other Activities: Simplifying the Split P&L
Back to the case at hand and the visual immediately above. X BV realizes that the back-office activity is auxiliary/supportive to the other activities. This is actually not a bad idea. The back-office tasks performed by X BV are used in service of all other activities proportional to the fte time total, except for Consultancy, which does its own back-office.
So, X BV’s first thought is to distribute the entire back-office sub-P&L to the other sub-P&Ls, based on the ftes and their time allocation. However, salaries and car costs can be tracked accurately and specifically to Consultancy as well, so there is no need (or justification) to generically distribute the back-office-related salary and car costs to Consultancy. This leads to the following matrix to determine the allocation of admin/back-office related costs to the other activities.

Applying the above-shown matrix to the split P&L, we get the following adjusted (and more compact) split P&L:
Having removed the admin column, X BV looks at the new version of the split P&L with satisfaction. Much simpler. Now X BV is in the right mood and decides that the Management activity should suffer the same fate. Again, this is not such a bad idea: the day-to-day management of the R&D operations can be seen to be part of the grander R&D activity. The same goes for Sales Support. As mentioned before, Consultancy is self-managed, so their sub-P&L is excluded from certain costs allocations, and the revenue of €900.000 is fixed, qualifying as ‘third party’ revenue from a ‘third party’ activity.
Pragmatic Benefit of Split P&L Simplification for Fundamental Activities
From a pragmatic Transfer Pricing perspective, absorbing the Management activity (as well as any other activity that is essential/fundamental to the business) into the other activities even makes a lot of sense. When you have decided on which Transfer Pricing Methods to use for the various activity types, you’ll want to take a deep-dive in a database to look for potentially comparable companies that have a very solid independency rating, a very low level of ownership concentration.
Filtering the benchmark results on this criterion renders the financial data and metrics pertaining to those potentially comparable companies clean and more valid, since those data and metrics should then be ‘untainted’ by intra-group / related-party transactions. Since such autonomous companies cannot function without their own management and back-office functions [i.e. essential functions], the financial data and metrics of those potentially comparable companies obviously include anything management- or back-office-related. If you’re able to merge those activities with other (more core-business) activities in the split P&L, it will automatically render the financial data and metrics so found more reliable and accurate in relation to the tested party’s activities.
Back again to the case at hand. Following the same logic as applied to the Admin activity absorption, we get the following allocation matrix for the Management activity and subsequent new split P&L.

Despite the crisp cleanliness of this simplified (and, in my view, improved) split P&L, it is, in part, still fundamentally flawed. As I already mentioned above, the simplification/merging steps did help in further delineating the Consultancy sub-P&L and it has also helped a lot in allocating X BV’s business-inherent costs, but the (gross or net) revenue levels shown are at this moment still determined solely based on the initial (gross or net) revenue figures of the pre-TP financial accounts.
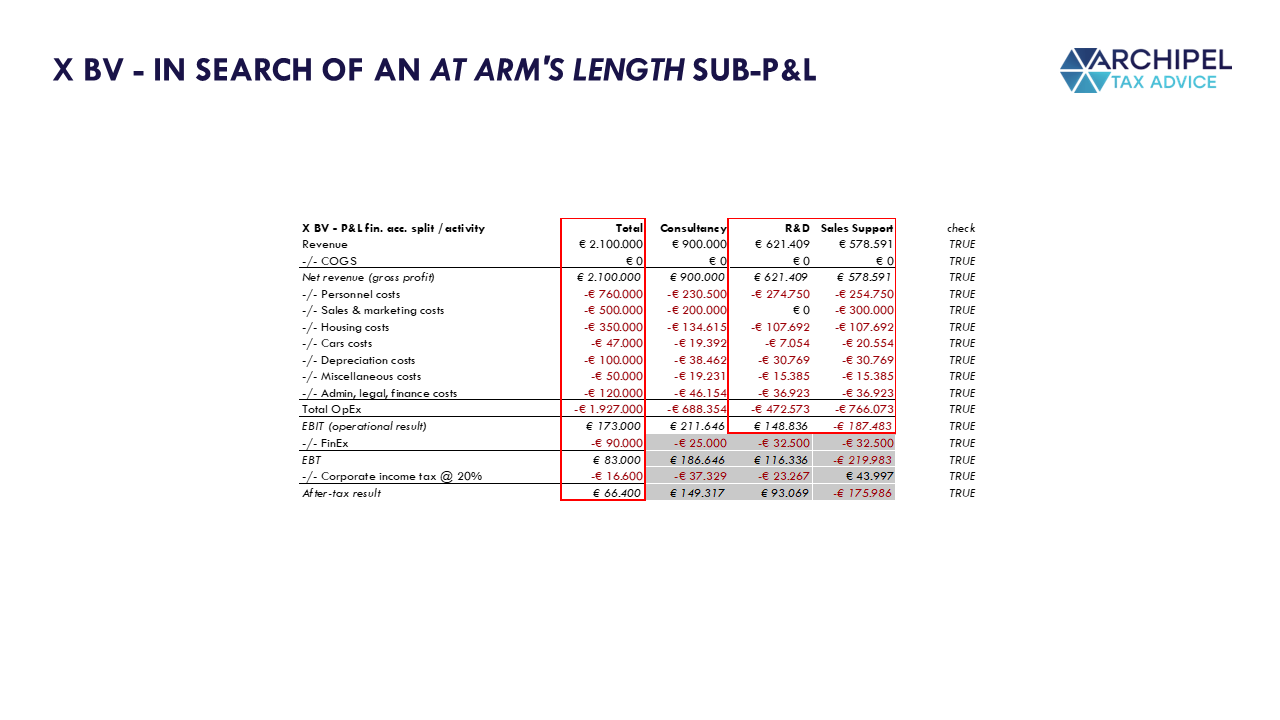
So, only after we determine the appropriate, TP-approved remuneration for the various intra-group activities, we can know what X BV’s taxable EBIT is. Please note, however, that the P&L Split and Simplification steps, as shown above, are often necessary steps to set up for a clean and clear sequel to the Transfer Pricing exercise.
The Various Transfer Pricing Methods and the Selection of the ‘Most Appropriate Method’
Selecting the ‘Most Appropriate Method’ is a very important step for Transfer Pricing. For clarity’s sake, before we continue with the Transfer Pricing exercise, I wanted to show you again, in a stand-alone visual not relating to X BV’s business example, what the various Transfer Pricing Methods do or entail.
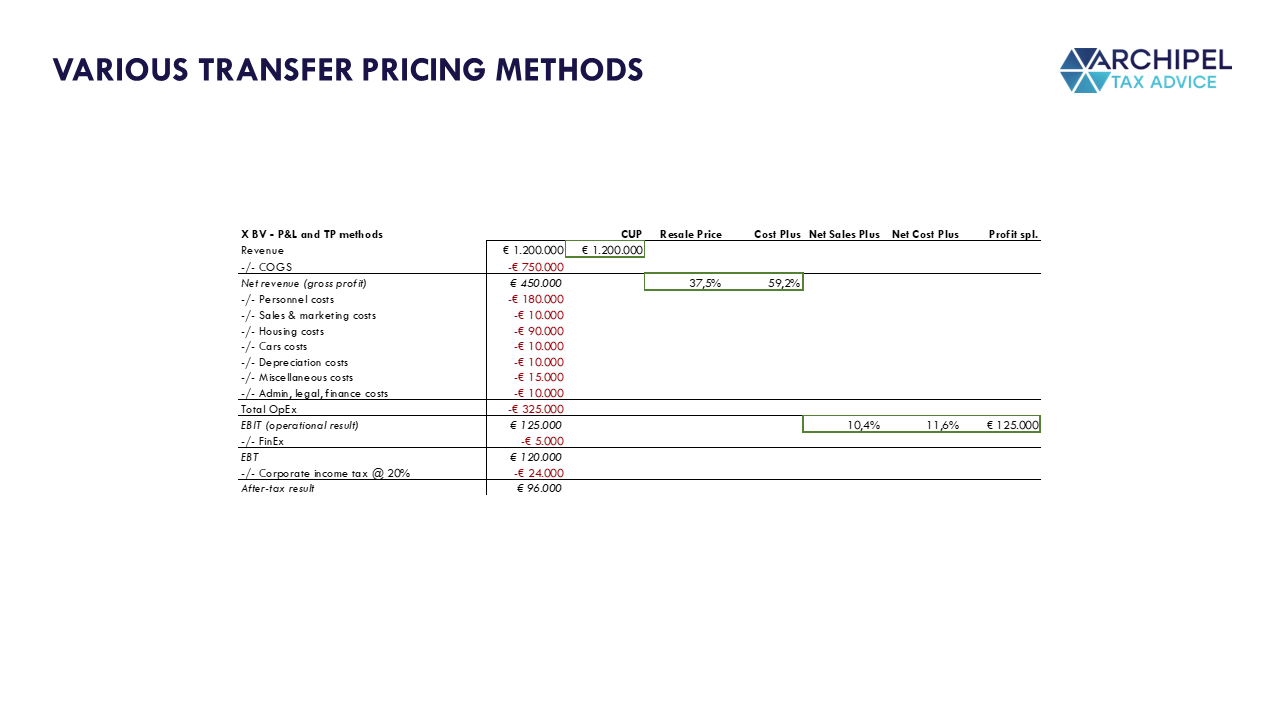
- The Comparable Uncontrolled Price (‘CUP’) Method assimilates the price of the goods it sells (or services it provides, though this is usually much less compatible with the CUP) to the price that a third party sells its (highly) comparable goods for.
- The Resale Price Method (‘RPM’) assimilates the Gross Margin (Gross Profit over Gross Revenue) to the Gross Margin that a comparable transaction or comparable company makes. If the COGS are known, e.g. because they are out-of-scope due to being a third party price, the Gross Revenue is the Transfer Price that can be derived, and vice versa.
- The Cost Plus Method (‘CPM’) assimilates the Gross Profit over ‘direct and indirect operational costs’, usually being the COGS and Deprecation, so excluding exploitational costs (OpEx), to that very same financial metric of a comparable activity or comparable company.
- The Transactional Net Margin Method (‘TNMM’) latches on to the (pre-tax) Net Operating Profit level instead of the Gross Profit level. The TNMM has a wide variety of Profit Level Indicators (‘PLIs’, simply being financial metrics, just like the CUP, RPM and CPM all use their own metric) relating to the Operating Profit in relation to either Gross Revenue, Net Revenue, Total Operational Costs, Operating Assets, or Capital Employed.
- Which PLI should be used, depends on the extent to which the PLI can be reasonably expected to result in a measure of arm’s length profit, the nature of the business activity being evaluated and the availability of comparable data. The same criteria hold for the initial selection of the Most Appropriate Method.
- If at least the routine functions and other functions, to the extent they qualify as ‘intra-group’, meriting the application of the methods mentioned above, are remunerated as such, and the remainder of the intra-group activities (i.e. the residual activities) are considered to e.g. make unique and valuable contributions to a group project/transaction, those residual activities can be remunerated under application of the (Residual) Profit Split Method (‘PSM’), the last of the OECD-acknowledged Transfer Pricing Methods. This can be either a loss split or a profit split, depending on whether the residual (group) activity is profitable or not.
Now, the OECD TP Guidelines state that taxpayers should select the most appropriate method. If the taxable remuneration of a sales company, providing sales prospecting and sales closing services to related parties, is based on that company’s costs, something doesn’t feel right. A sales company (or sales activity) is usually incentivized by a commission (percentage) of sales closed, so it would make more sense to base its remuneration on sales made.
For X BV, we now have just the R&D activity and Sales Support activity.
X BV’s R&D Activity: Method Selection
The R&D function looks a lot like Contract R&D, because:
- HQ LLC specifically instructs X BV to research and develop certain things;
- HQ LLC contractually is the owner of any IP created;
- X BV does not bear the market risk of failure in the IP development (e.g. research turns out to be unsuccessful or IP turns out to be worthless);
- X BV is not involved with the manufacturing, assembly, etc. relating to the IP; and
- X BV is contractually compensated for its costs.
Furthermore, the research team does not possess unique skills and experience, does not assume risks beyond the scope of the contract, et cetera. So the Profit Split Method need not be considered in this case.
X BV’s Contract R&D activity should, in my view, be entitled to a remuneration of its costs plus a mark-up that reflects the complexity and innovativeness of the research. So, there are just two methods to choose from in this case: the (Gross) Cost Plus Method and the ‘TNMM on a costs-basis’, a.k.a. Net Cost Plus.
The (Gross) Cost Plus would require delineating cost categories, and with X BV’s R&D activity there do not appear to be that many non-OpEx costs other than depreciation, which further decreases the usefulness of the Gross Cost Plus. In practice, the TNMM is often preferred because data on prices (CUP) or gross profits (resale-price method or cost-plus method) are not readily or reliably available in public sources. Therefore, we choose the Net Cost Plus Method for this case.
X BV’s Sales Support Activity: Method Selection
The supportive nature of the this activity may bring difficulties in selecting the most appropriate method, because ‘support’ is often linked to a cost-based remuneration, whereas the ‘sales’ component has us inclined to a sales-based remuneration. As mentioned above, the Sales Support team of X BV does not merely perform routine tasks, but rather ‘goes beyond’ those and actively participates in strategic sales initiatives.
The Sales Support activity directly impacts revenue generation by assisting the HQ LLC sales team and enhancing customer relationships. A sales-based remuneration model would do this Sales Support team justice, as it directly links their efforts to the financial success of the company, incentivizing them to contribute to sales growth. In situations where Sales Support plays a crucial role in market penetration or expansion, a sales-based remuneration better reflects their contribution to the overall profitability. Their risks are limited though, so a Profit Split, again, seems out of order in this regard.
Again, we can choose from (mainly) two methods: the Resale Price Method and the TNMM on sales basis. These are sometimes referred to as the Gross Sales Plus and Net Sales Plus methods respectively, because the difference between these two methods is of an identical nature as the difference between the Gross Cost Plus and Net Cost Plus methods.
A case can be made for both methods (Net/Gross Sales Plus), but I want to apply the Gross Sales Plus (Resale Price) Method (‘RPM’), even though the Sales Support activity of X BV does not actually ‘resell’ goods or services. In practice, a lack of physical asset transactions will almost always have tax professionals steer away from the RPM. This does not mean that the RPM can’t be used, however. At least for purposes of this article.
The RPM typically directly analyzes the ‘resale price’ to an independent enterprise and deducts the reseller’s gross margin, arriving at an arm’s length price for the original transfer. This aligns closely with the specific transaction under review, more so than when you’d also factor in the OpEx incurred by that reseller. For argument’s sake, X BV will go forward with the RPM for X BV’s Sales Support activity.
Mark-Up Percentages
After a thorough Benchmark Study, X BV finds an Interquartile Range for both the [Operational EBIT over Total Operational Costs] and [Operational Gross Profit over Operational Gross Revenue] metrics for the Net Cost Plus and Gross Sales Plus respectively. The median values of these ranges are, in that order, 10% and 70%. Taking the median values (often referred to as ‘central tendency’) is normally only required if the (reliability of the) comparability of the benchmark comps is low, which X BV deems to be the case.
Applying the Net Cost Plus Method to the R&D Activity
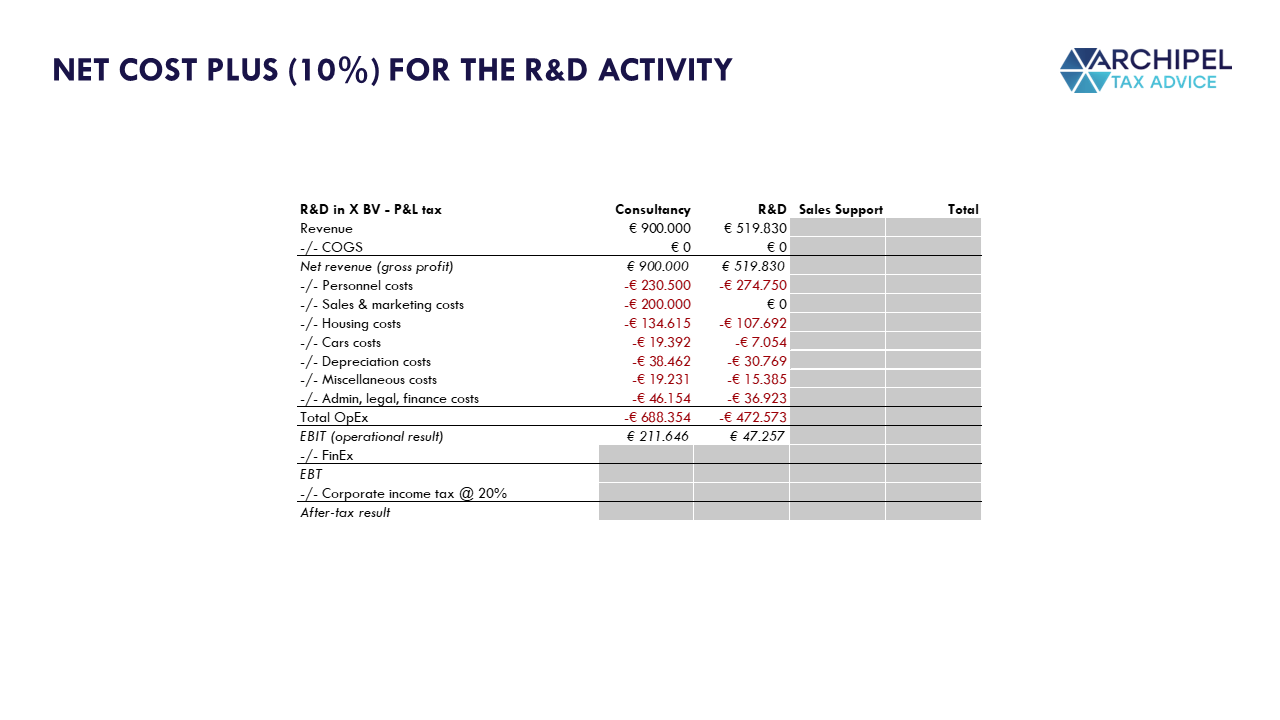
Seeing as X BV has already quite accurately delineated the total operational cost base of its R&D Activity, being €472,573, and the arm’s length operational EBIT for this activity is 10% thereof, the R&D Activity is (fiscally) entitled to €519,830 in revenue, as is shown in the following visual.
Applying the RPM (Gross Sales Plus Method) to the Sales Support Activity
If the arm’s length / third party operational gross revenue in this sub-P&L is known, application of the RPM results in the determination of the arm’s length level of COGS. Vice versa, if the arm’s length / third party COGS are known, the RPM determines the arm’s length level of operational gross revenue. In X BV’s case, there appear to be no COGS, and the operational gross revenue is derived from the not-yet-TP-approved split P&L. However, we can approach the Sales Support’s revenue allocation to X BV by using a Value Chain Analysis and RACI-model.
The RPM is a one-sided transfer pricing method, which examines the gross profit margin earned in a controlled transaction from the perspective of only one party, in this case X BV (specifically its Sales Support activity/department), whereas the RACI-model can be multi-sided / multilateral, because it examines a business initially without regard to corporate boundaries.
Now, please note that e.g. a RACI-model is a tool that, in practice, is increasingly being utilized for PSM purposes, which makes a lot of sense. The PSM is a bilateral / two-sided (or more generally: multi-sided / multilateral) method, which the RACI-model can be as well. So in essence, when we utilize a RACI-model to solve for one element of the RPM formula, we are combining one-sided and two-sided methodologies.
In our case, it is known that the group’s Spaghetti sales (Gross Revenue) is €3.000.000. If we can apply said RACI-model to determine which part of that €3.000.000 is allocable to X BV, we’ll have only one unknown (COGS) left in the RMP metric/formula, as a consequence of which we can complete the Sales Support sub-P&L.
The RACI model input is as follows: X BV has two employees on its payroll that make up X BV’s Sales Support function: Gerri and Joshua. Even though they constitute two entire fte for Sales Support, Gerri’s role within the group’s grander Spaghetti Sales is labelled ‘Consulted’, which means she is not as elemental/crucial/important to the group’s Spaghetti Sales as, let’s say, Joshua, who is labelled ‘Responsible’. HQ LLC’s employees active in the Spaghetti Sales are also factored in: I refer to the visual below.
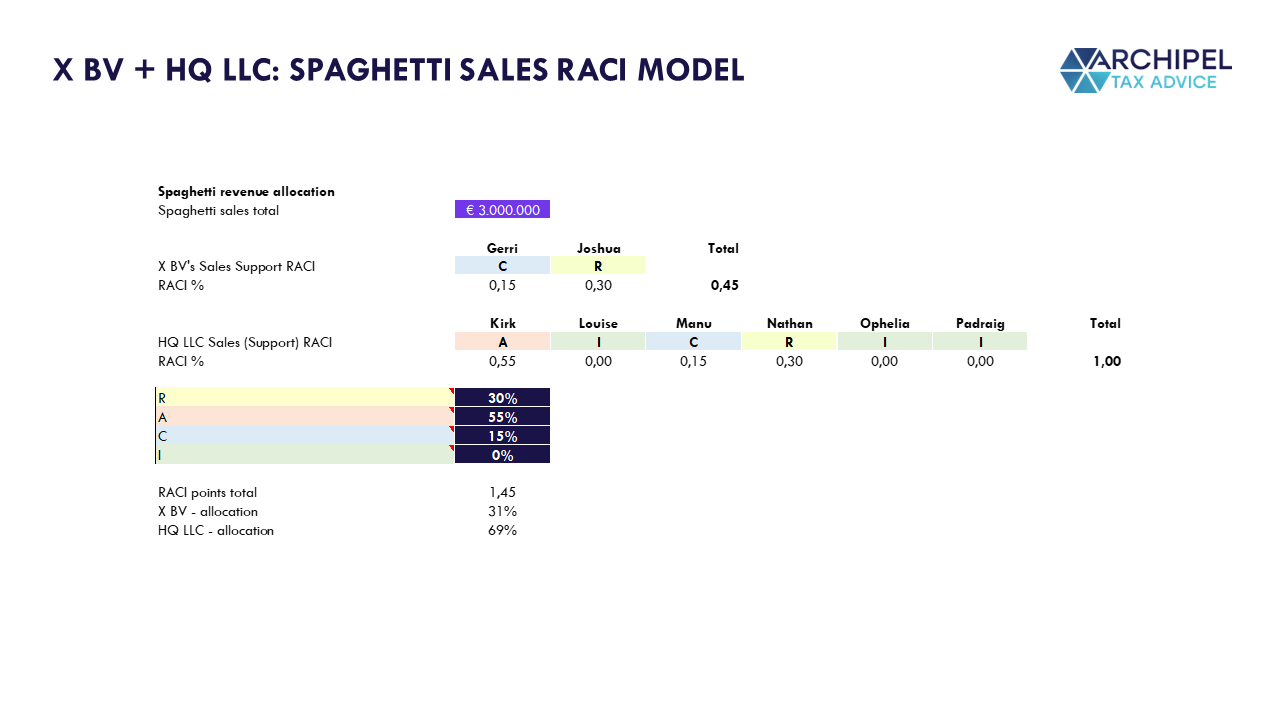
The fte labelled as ‘Informed’ are the least valuable to the business process and merit no revenue allocation. Kirk is the Accountable/Approver, which is the single-most important role within a business process. Regardless of how much of their time the fte spend on the Spaghetti Sales business process, the roles are what they are. So even if Gerri spends all of her time on Sales Support and Kirk spends only 40% of his time on Spaghetti Sales, the weight of Kirk’s role in terms of the group’s said revenue allocation is not proportional to that 40%.
In the end, this (simplified) model determines that X BV is entitled to 31% of the Spaghetti Sales revenue of €3.000.000 (being €931.034), which means we can now complete X BV’s Sales Support sub-P&L and, therefore, also the total TP-approved P&L which will state the taxable net operating profit. Since we said that the RPM would work with a Gross Margin of 70%, the COGS automatically must be €279.310.
Finalizing the Split P&L and Arriving at the TP-Approved Total P&L
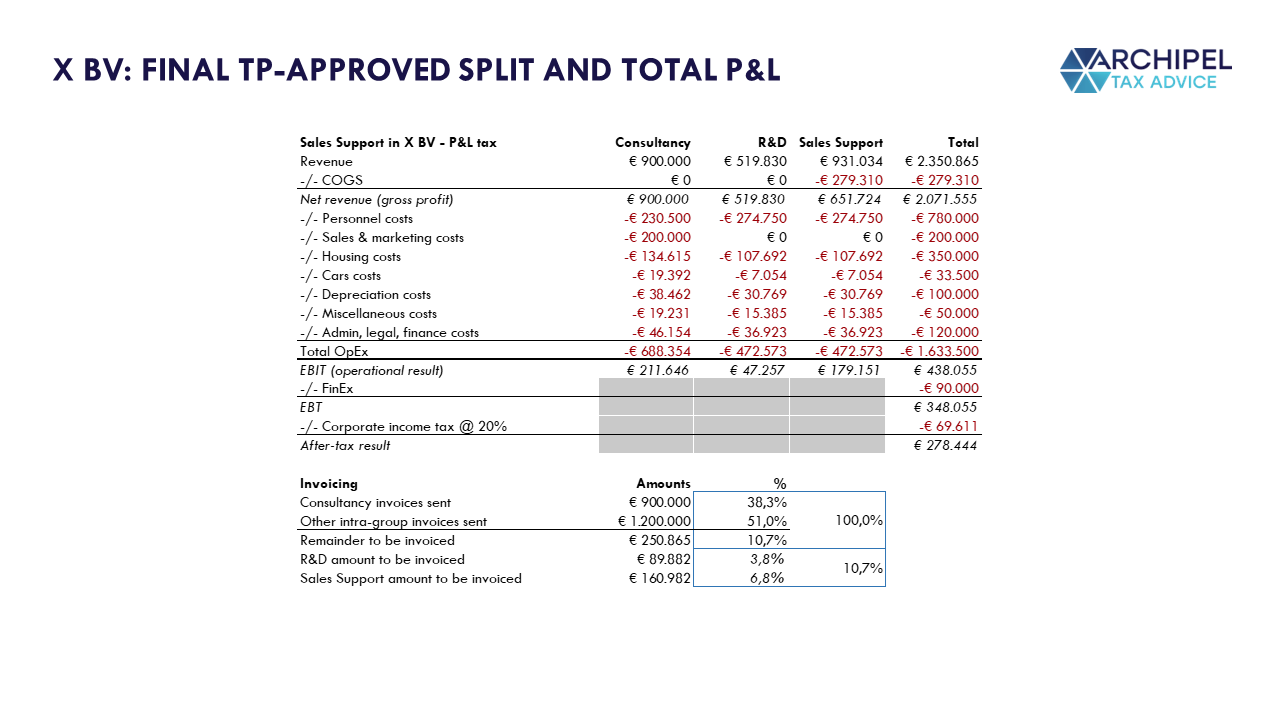
In practice, such COGS, especially now X BV does not actually have any related-party acquisition costs, are usually not labelled COGS but as ‘other costs’ further down in the (fiscal) P&L, as long as the taxable EBIT within the Sales Support activity for that year amounts to €179.151. In the end, what matters most is the correct, TP-approved determination of X BV’s taxable profit as long as it can be substantiated by financial models as shown in all of the visuals above.
Practical Implementation of the Transfer Pricing Results
In a simplified world view, Companies may either (i) file their tax returns in accordance with the arm’s length principle, or (ii) get corrected by the Tax Authorities in their tax assessments in accordance with the arm’s length principle. It is common practice for companies to have a Transfer Pricing policy and intercompany contracting pursuant to which the actual intra-group fees and invoicing follow the arm’s length principle.
In the Netherlands, this is not a prerequisite by law: here, the fiscal P&L and fiscal balance sheet (tax accounts) can be seen as a separate layer on top of the financial accounts, between which such TP-related differences are allowed to exist. This is part of the reason why there are ‘secondary adjustments’ in Transfer Pricing. There are countries, however, that require tax payers to align their intercompany contracting and invoicing with the TP policy.
For simplicity’s sake, we recommend alignment of TP and the contractual reality. Intercompany contracting (often in the form of an ‘intercompany service agreement’ or something similar) is also useful for the contractual risk distribution/allocation regarding the intercompany services, which can further substantiate the TP positions taken.
Now, if the above has either dazzled you or piques your interest, feel free to contact me through the plugin just below!


